Fig. 3.
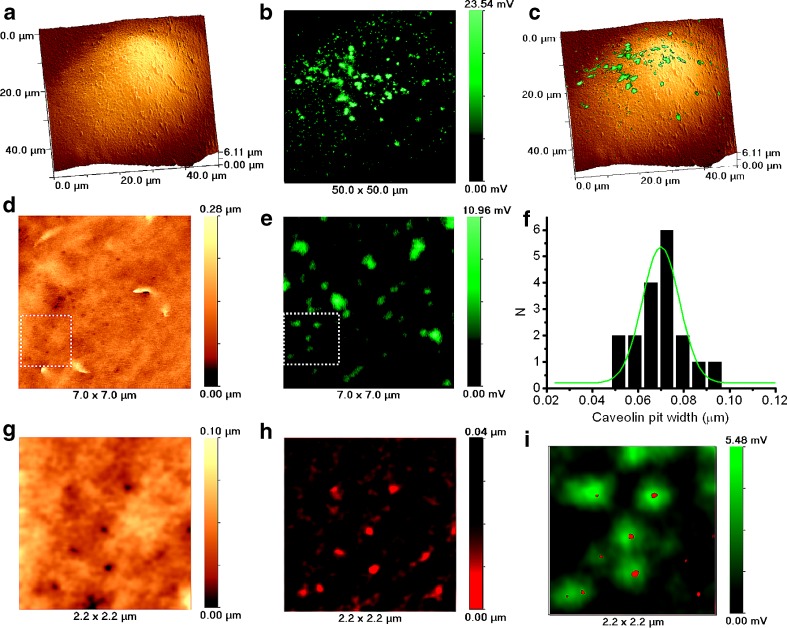
Topographical and fluorescent imaging of caveolin pits in fixed caveolin-GFP transfected Cos-7 cells by SSCM. a Topographical image of cell. b. Fluorescent image of caveolin-GFP transfected cell shown in a. c 3D representation of overlaid topographical and fluorescent images shown in a and b, respectively. d High resolution topographical image of cell surface. e High resolution fluorescent image of caveolin-GFP transfected cell shown in d. f Caveolin pit width distribution histogram calculated from SICM topographical images. g Digital zoom of the topographical image shown in d (dotted square) revealing numerous caveolin pits. h Same zoomed topographical image as in g but inverted and presented in a red palette. i Overlaid inverted topographical image shown in h and digitally zoomed fluorescent image from the area shown in e (dotted square). The image reveals that pits match the caveolin-GFP fluorescence

