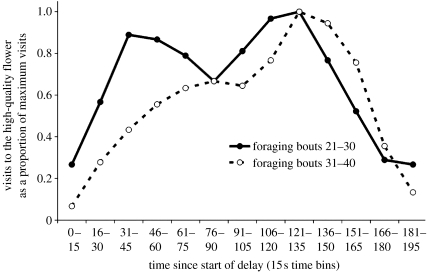
Figure 5.
Visits to the HQF during the 150 s delay condition. Visits are shown as a proportion of maximum visits, recorded in 15 s time bins. The solid line shows data from the first half of the 150 s delay phase (foraging bouts 21–30), while the dashed line shows data from the second half of the 150 s delay phase (foraging bouts 31–40).

