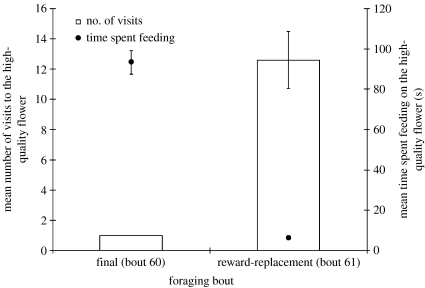
Figure 6.
Number of visits and time spent feeding on the HQF. Bars show the number of visits to the HQF after the delay elapsed during the final foraging bout and the reward-replacement test. Circles show the time spent feeding on the HQF on the first visit after the delay elapsed during the final foraging bout and the reward-replacement test. The time-interval equalled 30 s on these foraging bouts. Error bars are standard errors of the mean.

