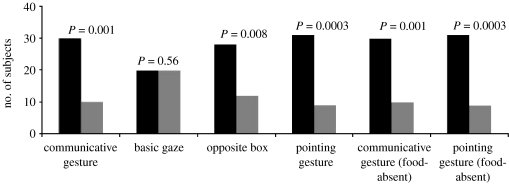
Figure 2.
Results showing the number of subjects that selectively inspected the box targeted by the experimenter's action (black bars) versus the box that the experimenter did not act towards (grey bars). P-values represent binomial probabilities with an α-level set to 0.05 (one-tailed predictions).

