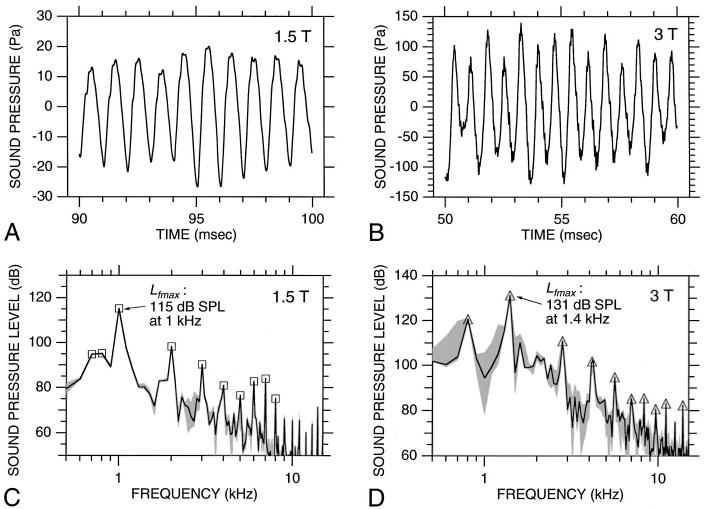
FIG. 3.
Temporal and spectral characteristics of gradient coil noise.(A) and (B) 10-ms segments of the gradient noise in Figs. 2(A) and (B), respectively. In each case [(A) and (B)], the plotted segment corresponds to the 10-ms time window containing Lf max. These windows are indicated by the short thick bars below the waveforms in Fig. 2.(C) and (D) Spectra computed from the waveforms in (A) and (B), respectively (solid curves). Shading indicates the range of spectra seen for the other waveforms recorded during the same session [using our standard imaging parameters as in (A) and (B), and for the 10-ms time window corresponding to Lf max]. Squares (C) and triangles (D) indicate the spectral peaks that were tracked versus time as described in Sec. III A 3. The maximum spectral level Lf max is indicated. Spectral resolution: 100 Hz.

