Figure 2.
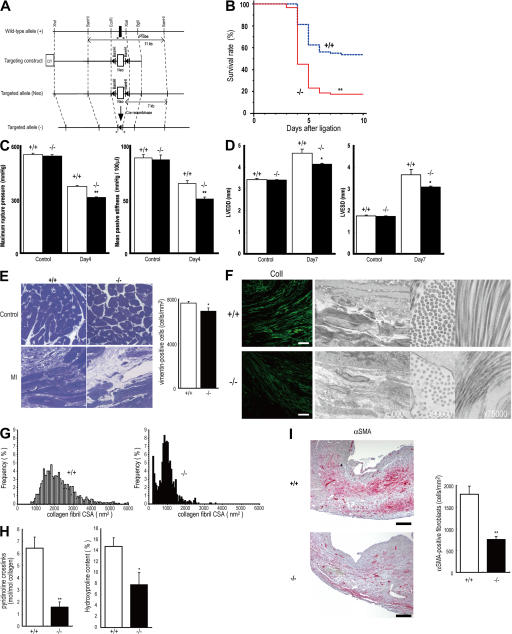
Cardiac rupture after AMI is caused by periostin disruption. (A) Schema of the targeting strategy deletes the first exon of periostin locus. (B) Decreased survival of periostin −/− mice (n = 91) compared with the survival of +/+ mice (n = 80) after AMI. **, P < 0.0001. (C) Infarct LV wall stiffness was more reduced in periostin −/− mice than in +/+ mice after AMI (left). Mean passive stiffness was also significantly lower in the −/− mice than in the +/+ mice after AMI (right). Open columns, +/+; filled columns, −/−. **, P < 0.005, compared with +/+ mice. (D) Loss of periostin attenuated cardiac dilation after AMI, as shown by echocardiography. Open columns, +/+; filled columns, −/−. *, P < 0.05 compared with +/+ mice. (E) Histological analysis of heart sections from periostin −/− and +/+ mice stained with toluidine blue 5 d after AMI, showing a lower number of cardiac fibroblasts and lower ECM density in −/− mice. (right) The number of vimentin-positive cells. *, P < 0.02, compared with +/+ mice. (F) Images of the infarct border stained with anti-collagen I (left), and TEM images of infarct border, showing evidence of smaller and less abundant collagen in tissues from periostin −/− mice 5 d after AMI compared with the collagen of the +/+ infarct heart. Bar, 50 μm. (G) CSA distribution of collagen fibrils in the infarct border of +/+ and −/− mice, measured from TEM images. (H) Biochemical analysis of the collagen amount and cross-linking. *, P < 0.05; **, P < 0.01, compared with +/+ mice. (I) The number of αSMA-positive cells in the infarct area was reduced in periostin −/− mice 5 d after AMI. (right) The number of αSMA-positive cells. **, P < 0.01, compared with +/+ mice. Error bars represent the mean ± the SEM. Bars, 200 μm.

