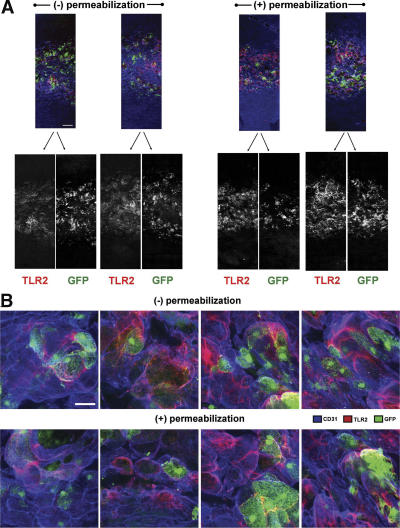
Figure 3.
Aortic TLR2 staining in the presence or absence of tissue permeabilization. (A) 20× lesser curvature circumferential strips taken from BMGFP+ LDLr−/− mice fed the HFD for 4 wk revealed no changes in TLR2 staining distribution in the presence or absence of tissue permeabilization. (B) Higher resolution 100× confocal images of lesser curvature regions from Fig. 3 A. Colocalization of GFP (green) and TLR2 staining (red), if it occurred, would have appeared orange to yellow on the higher power images. Bars: (A) 150 μm; (B) 25 μm.

