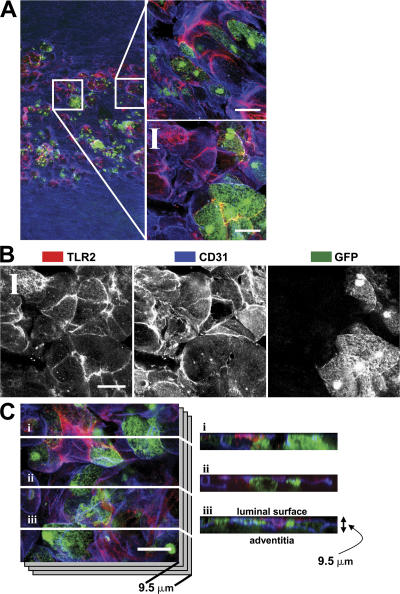
Figure 8.
Luminal TLR2 expression was confined to endothelial cells. Aortic segments from BMGFP+ LDLr −/− chimeric mice fed the HFD for 4 wk were examined to identify regions of TLR2 expression (red) and BMGFP+ leukocyte (green) accumulation. Endothelial cells (CD31) are blue in all images. (A) A circumferential composite image centered on the lesser curvature region demonstrated that areas of endothelial TLR2 staining (blue + red = purple) did not colocalize with BMGFP+ leukocytes. Inset areas bounded by white boxes (120 × 120 μm) are shown at higher magnification to the right of each image (B) A better appreciation of the distribution of TLR2, CD31, and GFP fluorescence can be seen with each fluorescence channel shown separately in grayscale. (C) A cross-sectional view of aortic TLR2, CD31, and BMGFP+ leukocyte accumulation further confirmed that TLR2 expression was confined to endothelial cells. Z-series image stacks spanning a depth of 9.5 μm were collected from the lesser curvature region. White lines i–iii denote the x-y locations where z-series imaging were performed. TLR2 expression (red) and BMGFP+ leukocyte (green) events did not colocalize; however, TLR2 expression was colocalized with CD31+ endothelial cells (blue+ red = purple). Bars, 25 μm.

