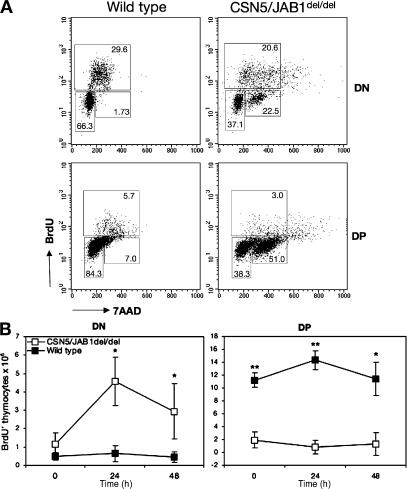
Figure 2.
Altered cell cycle progression in developing CSN5/JAB1del/del thymocytes. (A) Cell cycle progression was assessed by a short (40-min) pulse of i.p. injected BrdU, followed by total thymocyte isolation and staining with FITC-conjugated anti-BrdU antibody, to detect DNA-replicating cells, combined with 7-amino-actinomycin staining as a measure of DNA content. Flow cytometry was performed on electronically gated DN (top) or DP (bottom) thymocytes from WT (left) or CSN5/JAB1del/del thymocytes. Percentage values for G0/G1 (2N DNA content), S (intermediate DNA content), and G2/M (4N DNA content) cells are shown in the respective regions. Shown is a representative experiment out of eight independent ones performed. (B) BrdU pulse-chase analysis. 4 mice per time point for each genotype (WT, filled squares; CSN5/JAB1del/del, empty squares) were given a 40-min pulse with i.p. injected BrdU, after which one group of mice per genotype was killed immediately (time 0) or at the indicated time points. Thymocytes were isolated, counted, and stained with FITC-conjugated anti-BrdU combined with surface staining with anti-CD4 and -CD8 antibodies to electronically gate DN and DP cells by flow cytometry. Shown is the number of BrdU+ thymocytes (mean ± the SD for each group of animals) gated as DN or DP by flow cytometry. *, P < 0.005; **, P < 0.001 (Student's two-tailed t test with equal variance).

