Figure 6.
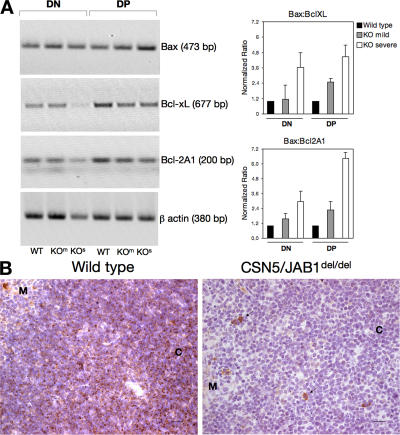
Altered mRNA and protein levels of Bcl-2 family members in CSN5/JAB1del/del thymocytes. (A) Semiquantitative RT-PCR for the indicated Bcl-2 family members was performed on retrotranscribed total RNA extracted from purified DN and DP thymocytes obtained from pools of 4–5 animals, belonging to either WT or to each of the indicated CSN5/JAB1 knockout phenotypes (KOm, mild; KOs, severe; Fig. S5 shows phenotypic clustering of CSN5/JAB1del/del thymocytes based on the DN:DP/SP ratio). Values were normalized on β-actin for each sample and expressed as fold induction over the expression levels detected in WT, DN thymocytes for each Bcl-2 family member. (right) The normalized densitometric ratios of Bax:Bcl-xL and Bax:Bcl-2A1 values. Error bars indicate the mean ± the SD of three separate experiments. (B) Immunohistochemical sections of 5-wk-old thymi from WT (left) or CSN5/JAB1del/del (right) mice stained with anti-Bcl-xL antibody (as revealed by HRP immunoenzymatic reaction). M, medulla; C, cortex. Bcl-xL shows a typical dotted distribution in WT thymocytes, which is particularly evident in the thymic cortex. (right) Arrows indicate isolated, strongly positive thymic epithelial cells in CSN5/JAB1del/del thymi, which otherwise show barely detectable expression of Bcl-xL compared with WT controls (left). Fig. S5 is available at http://www.jem.org/cgi/content/full/jem.20070725/DC1. Bar, 20 μm.

