
FIGURE 1. GHS-R expression in human astrocytoma cells.
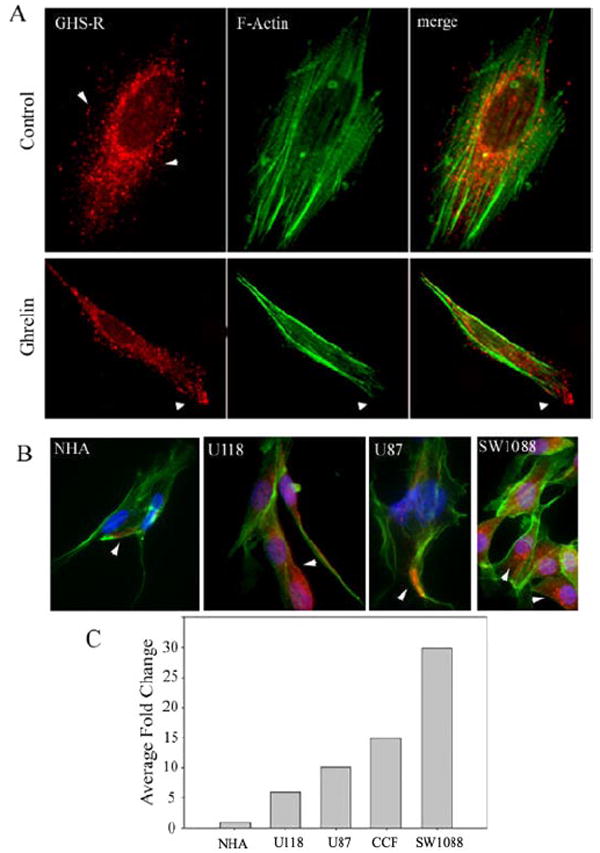
A, CCF-STTG1 (CCFS) cells were labeled for GHS-R (red), and F-actin was visualized using Alexa Fluor 488-labeled phalloidin (green). Control cells (upper panels) displayed a diffuse distribution of GHS-R. Upon ghrelin treatment (100 ng/ml), GHS-R was redistributed to the leading edge of the cell (lower panels). B, GHS-R protein (red) was widely expressed in U-118, U-87, and CCF-STTG1 cells compared with NHAs. C, shown is the -fold change in GHS-R 1a mRNA expression after normalization with glyceraldehyde-3-phosphate dehydrogenase as measured by real-time reverse transcription-PCR.