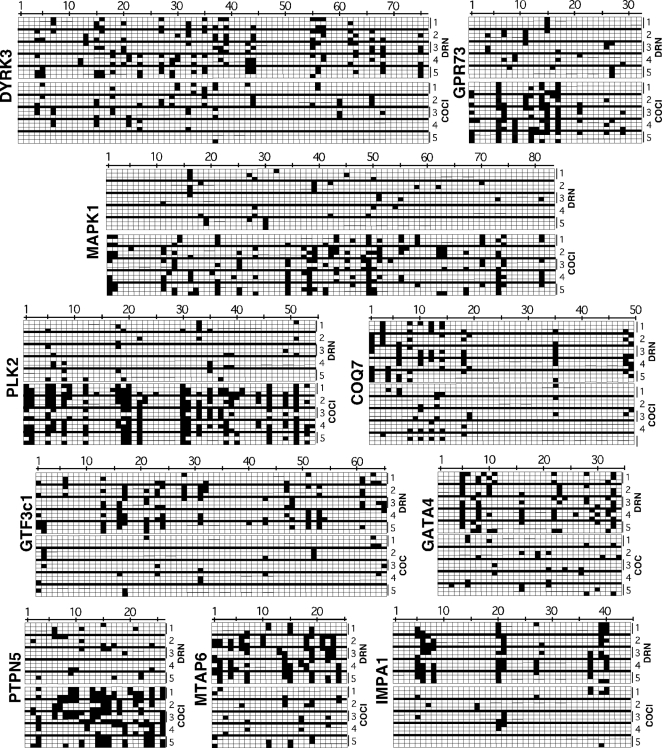
Figure 6. CpG methylograms of selected abnormally methylated promoters in P3 mice.
From the MeDIP/CGI array-generated methylation profiles, ten cocaine-induced abnormally methylated CGIs known to be associated with gene promoter regions were selected and cloned, followed by bisulfite sequencing to identify the relative locations of methylated CpGs in the gene promoter sequence. For each chart, the name of the promoter is shown on the left vertical while the horizontal numbers mark the CpGs on the sequence; the CpGs are numbered from the 5'end of the clone. The vertical numbers on the right (1–5) indicate data rows for samples from each of 5 animals from the control (upper, DRN) and cocaine (lower, COC) groups. For each sample, three clones were sequenced, hence the three sub-rows available to each sample for methylation mapping. For each sub-row representing a clone, white squares indicate unmethylated CpGs while black-filled squares indicate methylated CpGs. If all three clones were consistent, the filled boxes would appear for each sub-row for that sample. If all 5 samples (mice) were consistent, then the filled boxes would extend vertically across all 5 rows. The relative density of filled boxes between the control (upper 5) samples and the cocaine (lower 5) samples provides a visual feedback on the relative levels of CpG methylation in these DNA regions. For example, clones of DYRK3 or COQ7 promoters contained lower proportions of methylated CpGs in the cocaine-treatment pups than in the saline-control offspring, whereas the converse applies in the case of GPR73 or MAPK1 clones.

