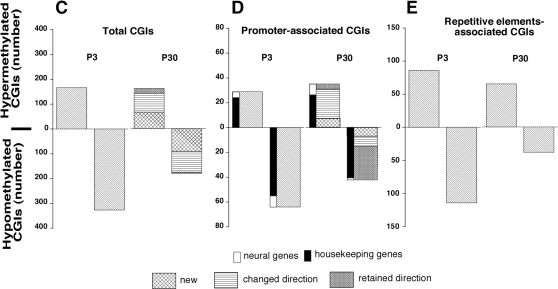
Figure 8. Effects of maternal cocaine exposure on CGI DNA methylation in P30 compared to P3 pups.
(a) Cocaine-induced hypermethylated and hypomethylated CGIs in P30 compared to P3 pups. Shown are the numbers of CGIs with altered methylation levels in cocaine-treated animals relative to saline-controls at each age. For P30 data, the number of CGIs with altered methylation levels that did not show a change at P3 (new) are indicated by a cross-hatched segment of the bar. Also indicated by differential shading are CGIs that were significantly altered at both P3 and P30, retaining or reversing their direction of change at P30 compared to P3 (retained direction; changed direction). (b) Hypermethylated and hypomethylated promoter-associated CGIs at P3 and P30. For both ages, CGIs associated with promoters of neural tissue-specific genes (neural genes) are represented by white bars, while CGIs associated with promoters of non-neural tissue-specific genes (housekeeping genes) are represented by black bars. In addition, for P30, the number of CGIs with altered methylation state undetectable at P3 (new) and the number of CGIs corresponding to the CGIs affected at P3, which either retained or reversed the direction of change (changed direction/retained direction), are indicated as in a. (c) Abnormally methylated repetitive element-associated CGIs at P3 and P30.

