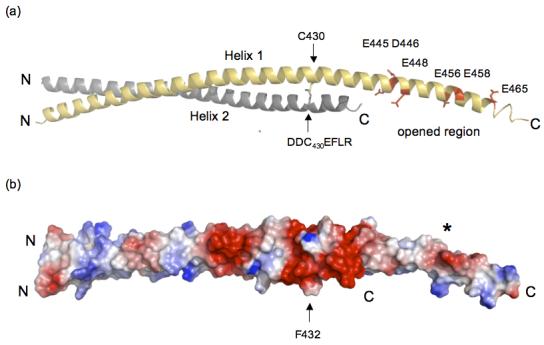
Figure 2.

(a) The opened region is highly negatively charged and is close to an interhelical disulfide bridge. Dimer 2 is shown and the colors of Helices 1 and 2 are the same as in Figure 1. There is a concentration of negatively charged residues in the open region (E445, D446, E448, E456, E458 and E465) indicated in red in Helix 1 (yellow). The C430 disulfide bridge between Helix 1 (grey) and Helix 2 (indicated by arrows) is directly upstream from the acidic opened region and is in the DDC430EF432LR stretch. The C-terminal end of Helix 2 is disordered and is not visible (see text). The ribbon model was created using PyMol [http://www.pymol.org]. (b) Surface potential analysis of HIP1 371-481 shows the opened region has a high negative potential (red surface marked by the asterisk). The position of the dimer is the same as in (a) and the arrow is F432 that is one residue away from the C430 disulfide bridge. The C430 disulfide bridge is in a region that forms an acidic ring around the HIP1 371-481 dimer (see red colored region around the arrow pointing to F432). The N- and C-termini in (a) and (b) are labeled N and C. The surface potentials (blue, positive; red, negative) were calculated using PyMol.
