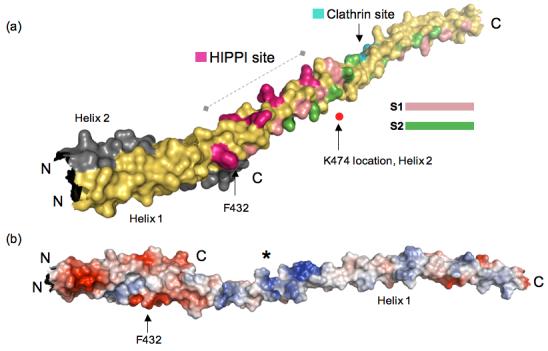
Figure 3.

(a) Reassembled HIP1 coiled-coil domain using HIP1 371-481 (PDB code: 2QA7) and HIP1 482-586 24 (PDB code: 2NO2) models. Helix 1 of 2QA7 is in yellow and Helix 2 is in grey (ends just after F432, C-terminus labeled C). The N-terminus of 2QA7 has been cut slightly shorter for this figure. The C-terminal half of the assembled model is 2NO2, but only Helix 1 of this dimeric structure is shown in this figure for the sake of clarity. The surface bracketed by F432 and K474 indicated by the dashed line is a surface suitable for HIPPI binding. The position of K474 as it would be in Helix 2 (grey) is marked by the red dot. The residues forming the putative HIPPI binding surface between F432 and K474 are indicated in purple. The S1 (pink) and S2 (green) hydrophobic paths we described previously in 2NO2 24 are mapped out in the assembled HIP1 model to show that the HIPPI site is not in the dimerization interface, but is solvent exposed. The DLLRKN clathrin light chain-binding region (Clathrin site) is indicated in teal, and is barely visible because it is on the opposite face of Helix 1. The surface model was generated using PyMol [http://www.pymol.org]. (b) Surface potential analysis of the assembled model reveals the putative HIPPI site in (a) is highly basic (indicated by the asterisk) and is exposed to the solvent. This model is rotated relative to the model in (a) to show the basic region and is not on the same scale as the model in (a). The N- and C-termini are labeled N and C. The surface potentials (blue, positive; red, negative) were calculated using PyMol.
