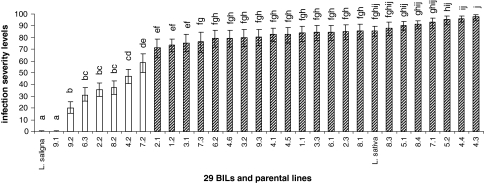
Fig. 2.
Infection severity levels of twenty-nine BILs and parental lines over six disease tests with B. lactucae are shown. Ninety-five percent confidence intervals are shown by lines on top of the bars. Letters in common indicate that the values are not significantly different (α = 0.01, Tukey HSD procedure). Striped bars represent lines not significantly different from L. sativa Olof. White bars represent lines that are significantly different from L. sativa Olof

