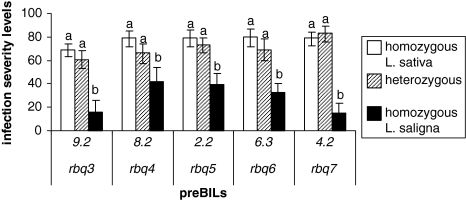
Fig. 3.
The allelic effects of five QTLs were measured in a disease test with B. lactucae Bl:14 on preBIL populations. Infection severity levels and 95% confidence intervals are shown per QTL per genotype class that was represented by five plants. Letters in common within preBIL populations indicate that the values for genotype classes are not significantly different (α = 0.05, Tukey HSD procedure)

