
Figure 1. Mast cells express cathepsin L and cathepsin S.
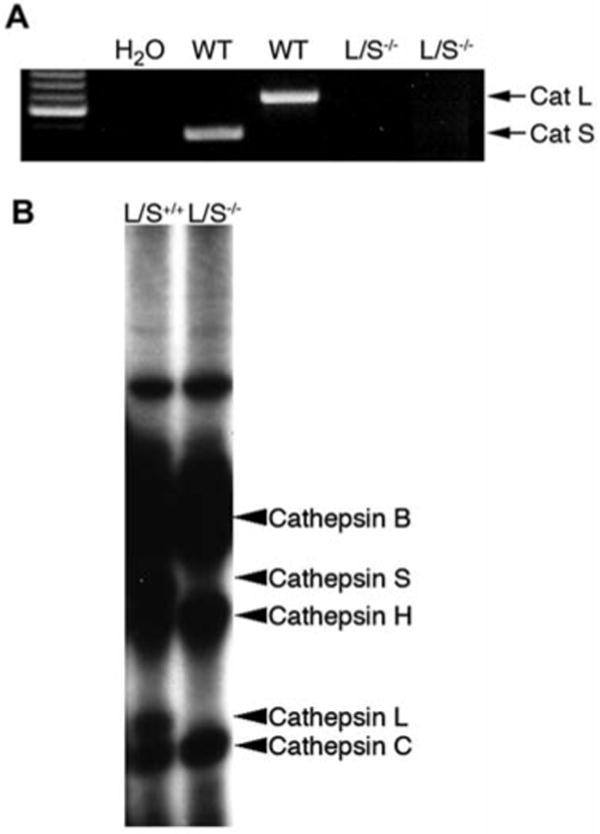
Mast cells were cultured from mouse bone marrow in 50% WEHI-3B-conditioned medium as described by Razin et al. (1984). (A) RT-PCR for cathepsin L and cathepsin S produced amplimers of predicted size on total RNA harvested from wild-type (WT) but not cathepsin L/S-/- BMMCs. Total RNA was isolated from cathepsin L/S+/+ or cathepsin L/S-/- BMMCs using an RNeasy Mini Kit (Qiagen, Valencia, CA, USA), and then reverse-transcribed into single-stranded cDNA using Superscript II reverse transcriptase (BD Biosciences, Palo Alto, CA, USA) and oligo dT primers. Cathepsin L and S transcripts in this cDNA were detected by PCR using the following primers: cathepsin L: forward, 5′-GTT GTG TGA CTC CTG TGA AG-3′; reverse, 5′-CTT GCT GCT ACA GTT GGG T-3′; cathepsin S: forward, 5′-CCA AGT GGG CAT GAA CG-3′; reverse, 5′-GCC AGT AAT CTT TGC CAT CAA G-3′. (B) Active site [125I]-JPM labeling of cysteine proteases. Cathepsin L/S+/+ or cathepsin L/S-/- BMMCs (2×10⁶ /sample) were labeled by culturing cells in the presence of [125I]-JPM ethyl ester for 24 h at 37°C as described by Liu et al. (2006). Cells were washed twice with PBS, lysed in SDS-PAGE sample buffer, and labeled proteins were analyzed by 12% SDS-PAGE and autoradiography.