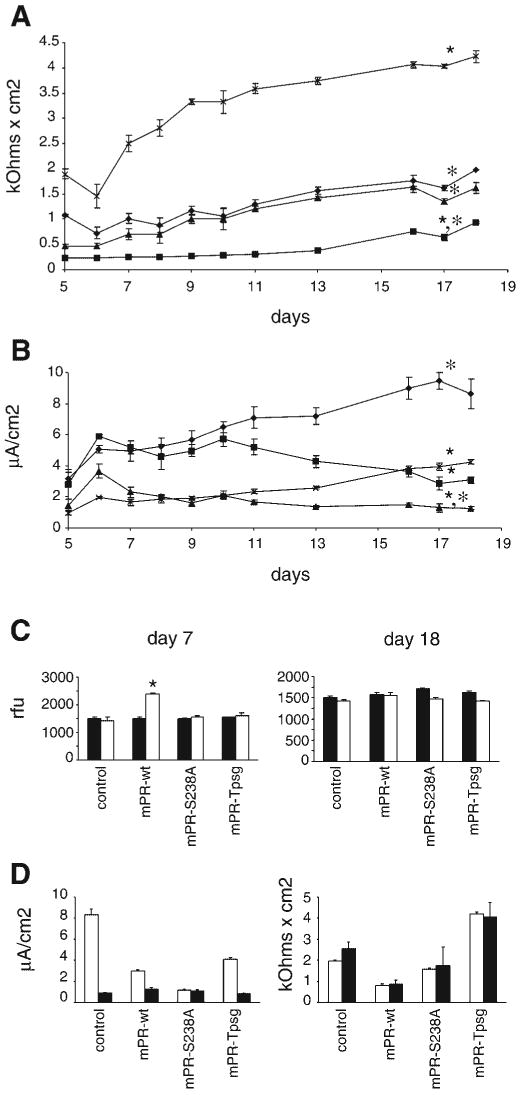
Fig. 6.

Effect of GPI anchoring and catalytic activity of prostasin on transepithelial resistance, current, and permeability. Stably transfected M-1 cell lines (described in Results and Fig. 5) were grown on 0.4-μm polycarbonate filters. Rte and potential difference were measured with an epithelial voltohmeter, and equivalent short-circuit current (Ieq) was calculated by Ohm's law. Data are expressed as means ± SE from 5 independent experiments with triplicate wells. Data were analyzed when resistance and potential difference were stable and monolayers of all cell lines were impermeable to inulin (data in C). A: time course of Rte in stable transfected M-1 cells overexpressing prostasin variants (♦, mPR-ctrl; ■, mPR-wt; ▲, mPR-S238A; ×, mPR-Tpsg). ★P < 0.05 compared with mPR-ctrl; *P < 0.05 compared with mPR-Tpsg. B: time course of Ieq in stably transfected M-1 cell lines. ★P < 0.05 compared with mPR-ctrl; *P < 0.05 compared with mPR-Tpsg. C: paracellular permeability of M-1 cell lines at days 7 and 18 of culture was assayed by measuring apical-to-basal flux of FITC-inulin (20 μg/ml) over 24 h. Data are expressed as means ± SE relative fluorescence units (rfu) in basal medium at 0 (filled bars) and 24 (open bars) h. Mean apical and basal fluorescence at time 0 were ∼23,000 and ∼1,600 rfu, respectively. ★P < 0.05 for comparison between 0 and 24 h. D: effect of amiloride on Ieq (left) and Rte (right) in stably transfected M-1 cell lines. Ten micromolar amiloride was applied to the apical surface of cell monolayers on days 18–19 of culture. Ieq and Rte were measured 45–60 min after exposure to amiloride. Open and filled bars depict baseline and postamiloride measurements, respectively. Data are expressed as means ± SE from 5 independent experiments with triplicate wells. Exposure to amiloride abolished the differences in Ieq between cell lines and reduced Ieq to similarly low current (P > 0.05). There was no difference in baseline and postamiloride Rte in any of these cell lines (P > 0.05).
