
Fig. 1.
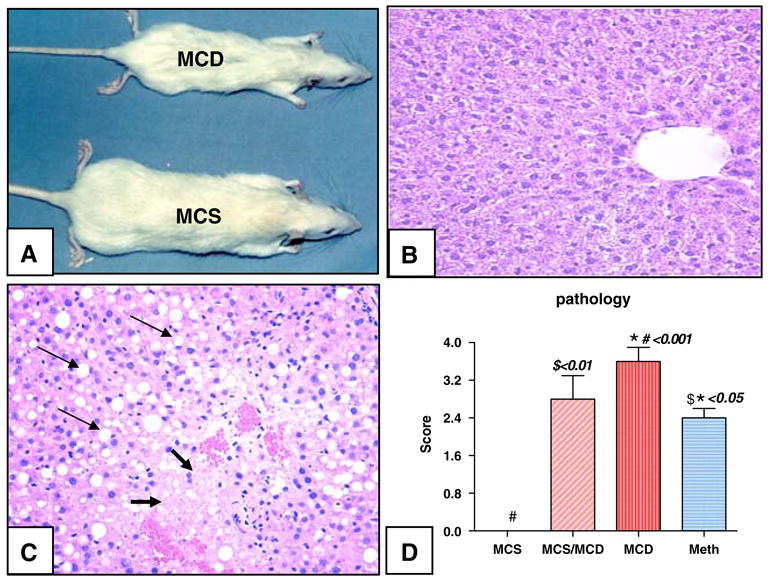
(A) Eleven-week-old representative rats on deficient (MCD) compared to sufficient (MCS) diets. (B) Normal hepatic section from MCS rat stained with H & E. (C) Representative slide from a representative rat on the deficient diet (MCD) showing severe hepatic fatty degeneration (thin arrow) and necrosis (thick arrow). (D) Hepatic pathology graded on a scale from 0 (representing no fatty degeneration, necrosis or inflammation) to 4+ (over 70% of hepatocytes showing fatty changes, necrosis or inflammation). Rats on respective diets for 3–5 weeks (MCS, MCD, or MCS/MCD) or treated with methionine supplementation for an additional two weeks [mean ± standard error on the mean (SEM), versus control]