
Fig. 5.
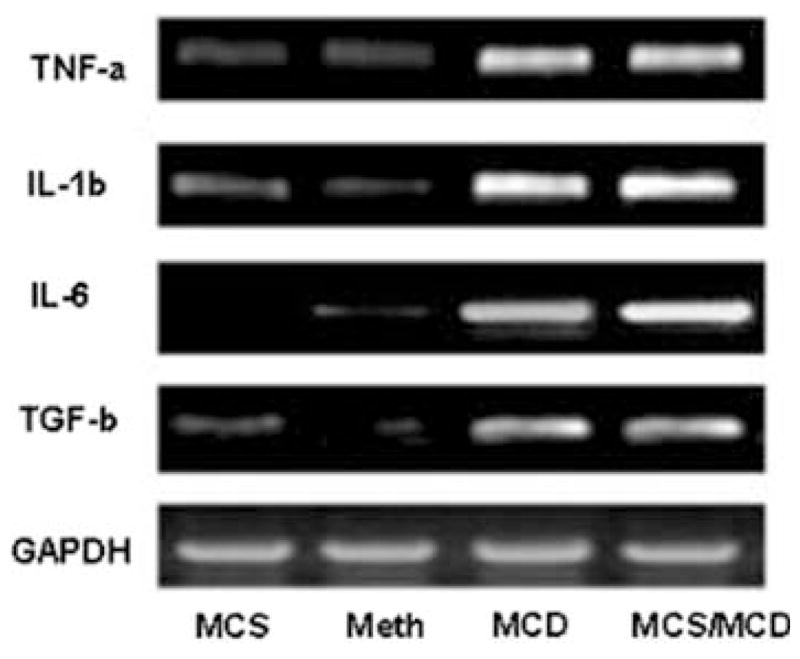
Gel representative RT-PCR analysis showing gene expression of hepatic cytokines in the MCS control diet (lane 1), MCD/Meth (lane 2), MCD (lane 3), and MCS/MCD (lane 4). The ratio of these genes were normalized with housekeeping GAPDH and are summerized in Table 3 (n = 4, mean ± SEM)