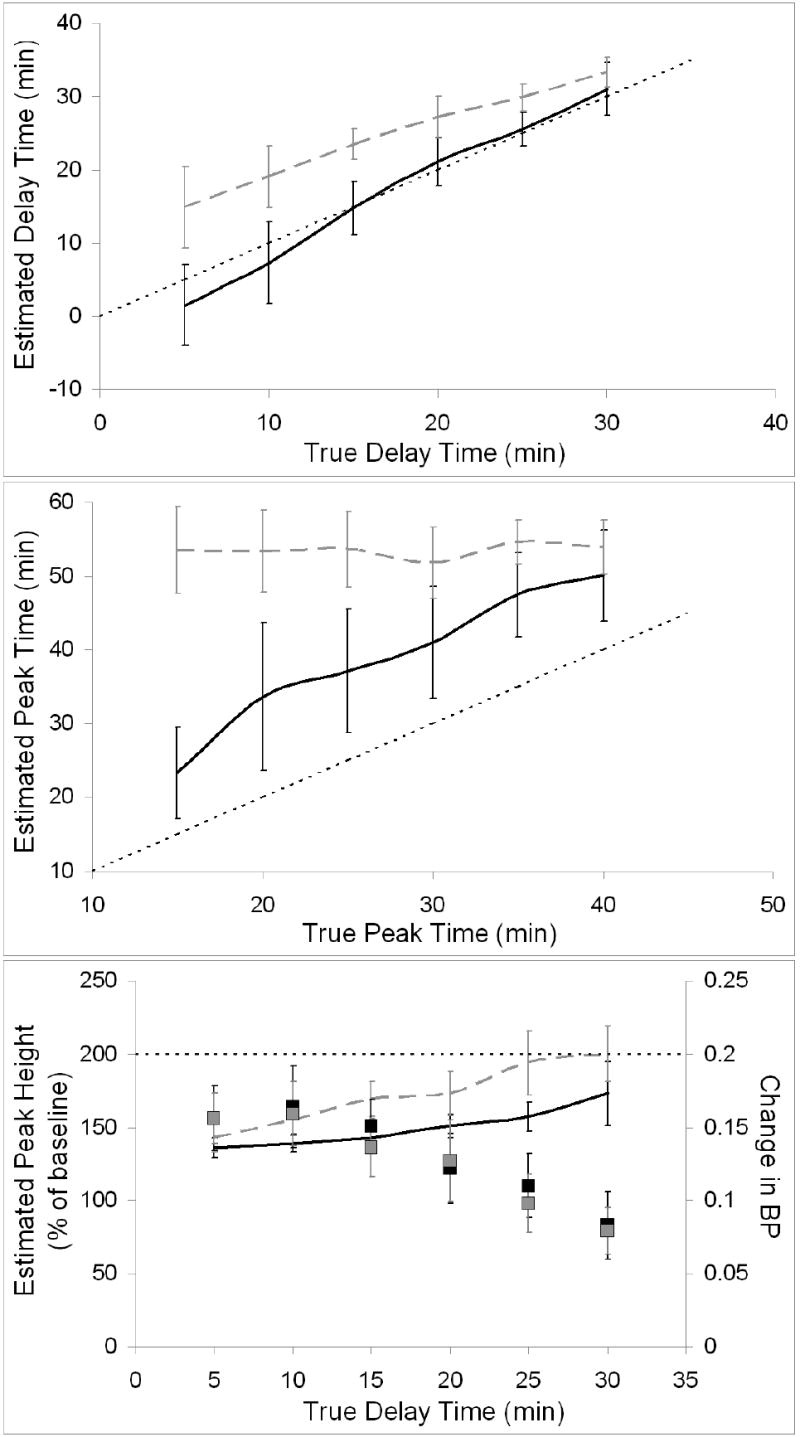
Figure 10.

Key NT parameters estimated by ART using biased TIFs. Estimates from data with slow metabolism are indicated by black curves and estimates from data with moderate metabolism by dashed gray curves. The line of identity is indicated by a think dotted black line. Top panel pertains to delay time, middle panel to peak time, and bottom panel to peak height. Measured changes in BP (slow metabolism indicated by black squares, moderate metabolism by gray squares) are included on peak height plot for comparison.
