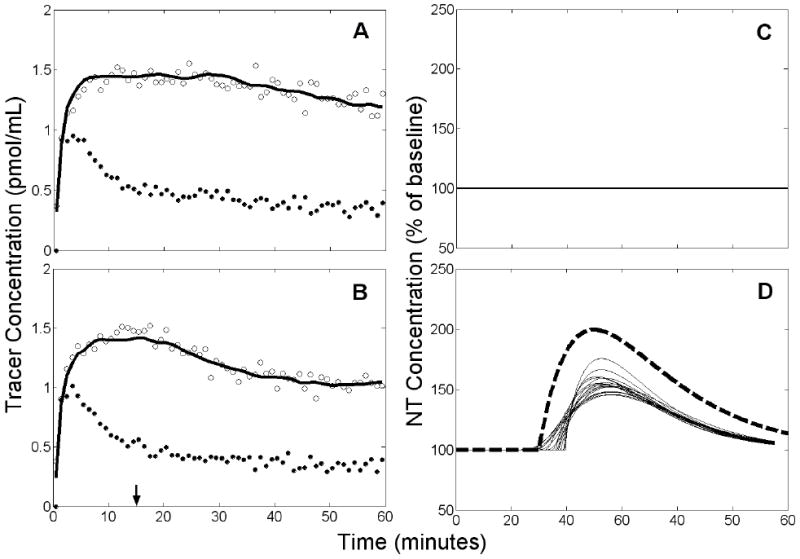
Figure 13.

Example of results obtained by applying REF to data with a true NT response and 10% decrease of at 15 min. Left panels (A,B): simulated PET data (open circles), measured plasma input (black circles), and model fit to the data (solid black curve). Arrow indicates time at which decreased and NT response commenced. Right panels (C,D): estimated NT response (thin solid curves) and true NT curve (heavy dashed curve). Top panels (A,C) apply to rest condition, bottom panels (B,D) to activation. There are 18 retained NT responses shown in D.
