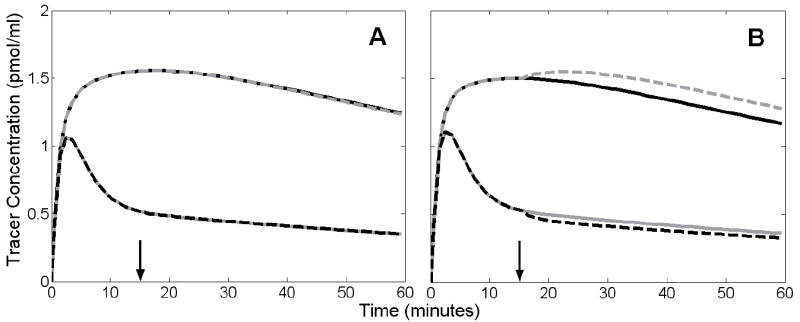
Figure 5.

Effect of altered tracer delivery on tissue time activity curves (TACs). Solid black curves and solid gray curves correspond to noiseless, simulated TACs from target and reference region, respectively, during rest condition. Alterations in delivery were simulated by instantaneously changing tracer parameters 15 minutes into activation scan. A. Increased blood flow to target region (dashed gray) and decreased flow to reference region (dashed black). These curves almost completely overlay the TACs from the rest condition. Arrow indicates time at which flow changes occurred. B. Increased K1 (dashed gray) and decreased (dashed black). Arrow indicates time at which K1 increased and decreased.
