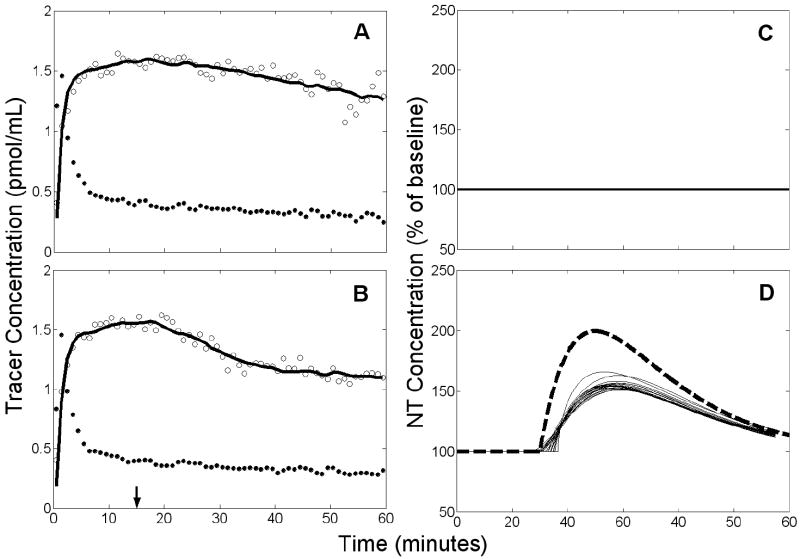
Figure 8.
Example of results obtained from data with true NT response by applying ART using a noisy, unbiased TIF. Left panels (A,B): simulated PET data (open circles), measured plasma input (black circles), and model fit to the data (solid black curve). Right panels (C,D): estimated NT responses (solid, thin curves) based on different initial parameters guesses and true NT curve (heavy, dashed curve). Top panels (A,C) apply to rest condition, bottom panels (B,D) to activation. There are 20 retained NT responses shown in D.

