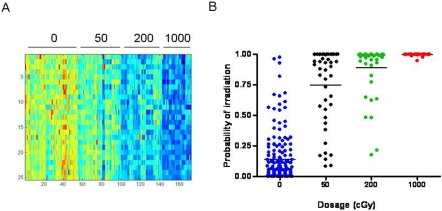
Figure 1. Peripheral blood gene expression profiles distinguish irradiated mice within a heterogeneous population.
(A) The left panel represents a heat map of a 25 gene profile that can predict radiation status. The figure is sorted by dosage (0 cGy, 50cGy, 200cGy, and 1000cGy). High expression is depicted as red, and low expression is depicted as blue. (B) The right panel is a graph of the predicted capabilities of the irradiation signature across all mice (including C57Bl6 and BALB/c strains, males and females and 3 sampling time points) versus a control, non irradiated sample. All predicted probabilities for the controls are listed.

