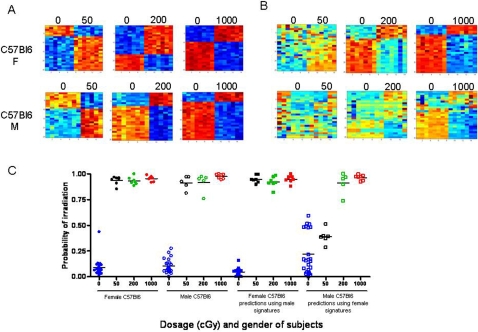
Figure 2. Impact of sex on murine irradiation profiles.
(A) Heat map images illustrating expression pattern of genes selected for classifying control, non-irradiated mice versus 50 cGy, 200 cGy, or 1000 cGy irradiated mice within female (top) and male C57Bl6 mice (bottom). (B) Heat map images illustrating expression pattern of genes found in the female C57Bl6 strain or male C57Bl6 strain predicting the irradiation status of the opposite sex at dosage 50 cGy, 200 cGy, 1000 cGy. High expression is depicted as red, and low expression is depicted as blue. (C) A leave-one-out cross-validation analysis of the classification for control (blue) versus 50 cGy (black), 200 cGy (green), and 1000 cGy (red) for the female C57Bl6 (squares) and male C57Bl6 (circles) samples is shown. The control probabilities for each prediction are shown.

