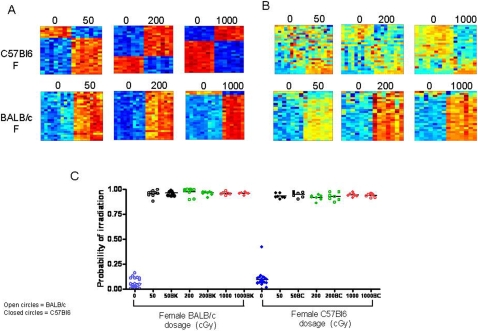
Figure 3. Impact of genotype on murine irradiation profiles.
(A) Heat map images illustrating expression pattern of genes selected for classifying control, non-irradiated samples versus 50 cGy, 200 cGy, 1000 cGy irradiated samples between female C57Bl6 strain (top) and female BALB/c strain (bottom). (B) Heat map images illustrating expression pattern of genes developed in one strain as predicting the other strain (C57Bl6 or BALB/c). High expression is depicted as red and low expression is depicted as blue. (C) A leave-one-out cross-validation analysis of the classification for control versus 50 cGy (black), 200 cGy (green), and 1000 cGy (red) for the female BALB/c and female C57Bl6 samples is shown. The control probabilities for each prediction are shown. BK represents the application of female C57Bl6 metagenes to predict the status of female BALB/c mice, and BC represents using female BALB/c mice metagenes to predict the status of female C57Bl6 mice.

