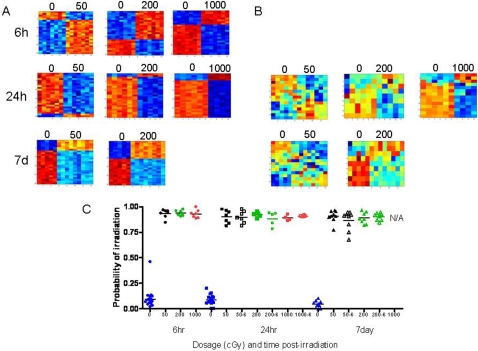
Figure 4. Impact of time on murine irradiation profiles.
(A) Heat map images illustrating expression pattern of genes selected for classifying control, non-irradiated samples versus 50 cGy, 200 cGy, 1000 cGy irradiated samples at time points 6hr, 24hr, and 7days. (B) Heat map images illustrating expression pattern of genes found in the 6hr time point as applied to the dosages 50 cGy, 200 cGy, 1000 cGy at 24 hr and 7 day time points. High expression is depicted as red, and low expression is depicted as blue. (C) A leave-one-out cross-validation analysis of the classification for control (blue) versus 50 cGy (black), 200 cGy (green), and 1000 cGy (red) for the time points 6 hr (circles), 24 hr (squares), and 7 days (triangles) is shown. The control probabilities for each prediction are shown.

