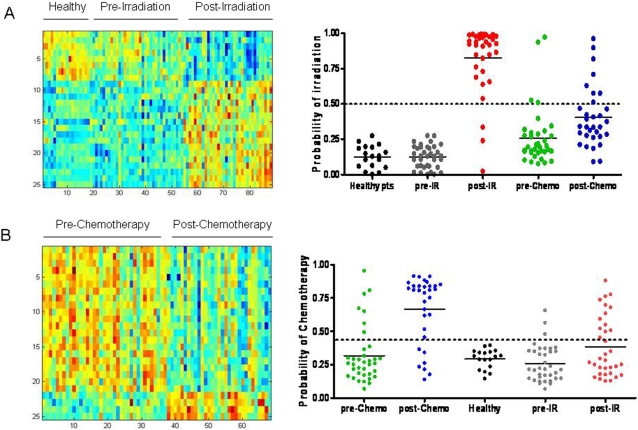
Figure 6. PB metagene profiles of human radiation exposure and chemotherapy treatment are accurate and specific relative to each other.
(A) The heat map on the left depicts the expression profiles of genes (rows) selected to discriminate the human samples (columns); high expression is depicted as red, and low expression is depicted as blue. A leave-one-out cross-validation assay (at right) demonstrated that the PB metagene of radiation was capable of distinguishing healthy donors (black), non-irradiated patients (gray), irradiated patients (red), pre-chemotherapy treatment patients (green), and post-chemotherapy patients (blue). A ROC curve analysis was used to define a cut-off for sensitivity and specificity of the predictive model of radiation. The dotted line represents this threshold of sensitivity and specificity. (B) The heatmap on the left depicts an expression profile of chemotherapy treatment that distinguishes chemotherapy-treated versus untreated patients. A leave-one-out cross-validation assay demonstrated that this PB metagene of chemotherapy treatment could accurately distinguish pre-chemotherapy patients (green), chemotherapy-treated patients (blue), healthy individuals (black), pre-irradiated patients (gray) and irradiated patients (red).

