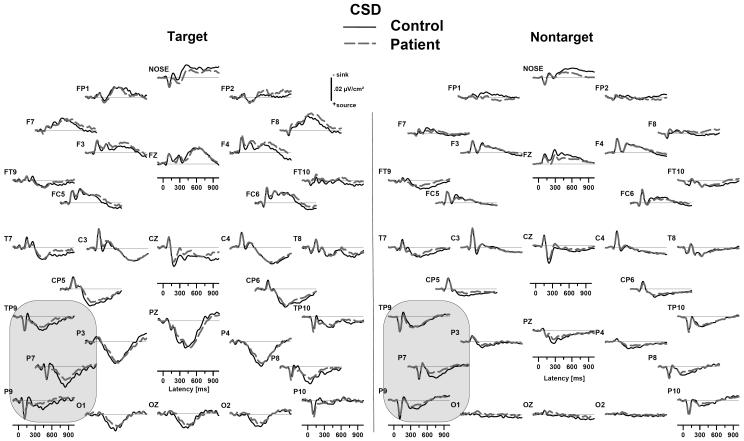
Fig. 4.
Grand mean surface Laplacian waveforms (source down) for healthy controls (solid black) and depressed patients (dashed gray), averaged across tonal and phonetic dichotic oddball tasks. Compared to controls, patients showed P3 source reductions for both targets and nontargets that were greatest over the left hemisphere at lateral sites where the N1 source was found (circled).

