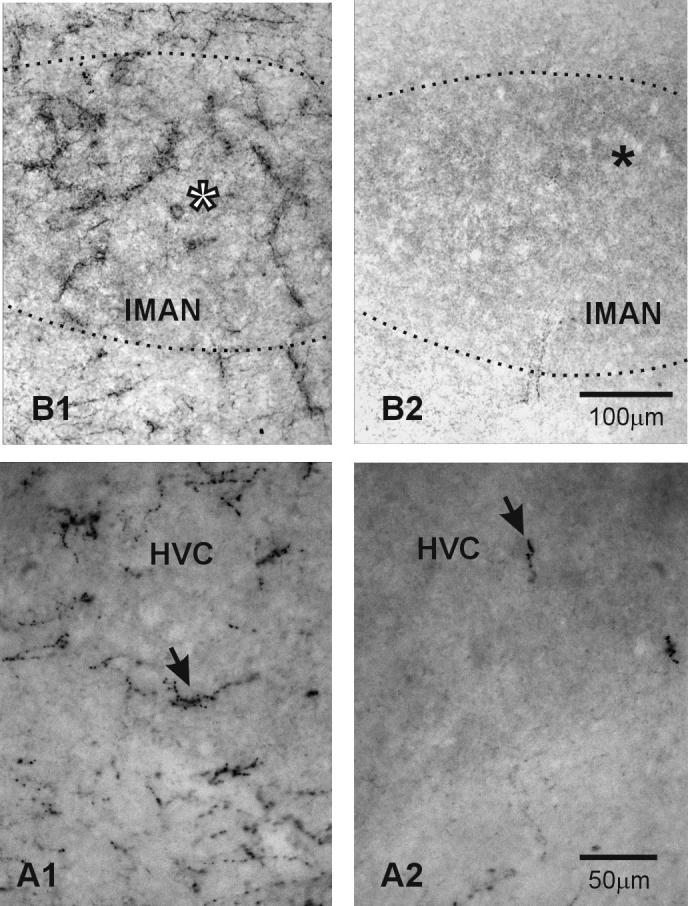
Figure 5.

Higher magnification of DBH-ir labeling in the sections of HVC and lMAN shown in Figure 4. In each pair, the brain on the left is from a saline-treated male, that on the right from a DSP-4-treated male. The arrows in HVC and the asterisks in lMAN in this Figure correspond to those in these areas in Figure 4. Note how the pattern and density of DBH-ir labeling over lMAN in the control bird is different from that outside the nucleus. This is particularly clear in comparison to the area below lMAN. If you refer back to Figure 4, you can see that the arrow in HVC in the control bird points to an area of dense labeling on the ventral border of the nucleus. It is clear at higher magnification that no labeling below the arrow matches the aggregations of high density DBH-ir labeling seen within HVC.
