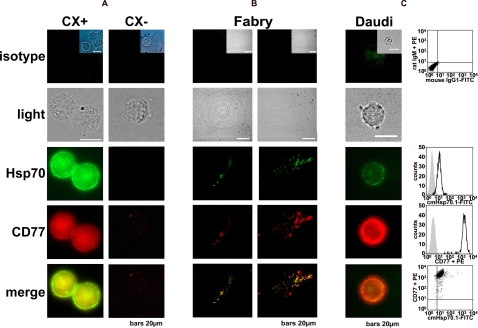
Figure 4. Bright field and fluorescence microscopic analysis of CX+ and CX− tumor sublines (A), Fabry fibroblasts (B), and Daudi Burkitt's lymphoma cells (C).
Cells were stained either with a relevant isotype-matched control antibody (isotype) or with an Hsp70 (cmHsp70.1-FITC, green) or Gb3 (CD77 plus Cy3-conjugated secondary antibody, red) specific antibody. The co-localization of Hsp70 and Gb3 is visualized in yellow as a merge of red and green in the lowest panel. Scale bar marks 20 µm. In comparison to CX+ and Fabry cells, the density of Gb3 on the cell membrane of Daudi cells is markedly increased, as indicated by a high mean fluorescence intensity of the CD77 staining. A double stain of Hsp70-FITC and Gb3-Cy3 indicates co-localization of both markers on the cell surface (lower right graph). Similar findings were obtained in experiments using the Colo+/Colo− tumor sublines (data not shown). On the right hand panel of Figure 4C, representative flow cytometric profiles of Daudi cells are shown; the upper graph represents the double staining pattern of the isotype-matched antibodies IgM-PE and IgG1-FITC; the graphs below show single staining of Daudi cells with Hsp70-FITC (second graph) and CD77-PE (third graph). The fourth graph represents the double-staining pattern of Daudi cells using Hsp70-FITC and CD77-PE antibodies.

