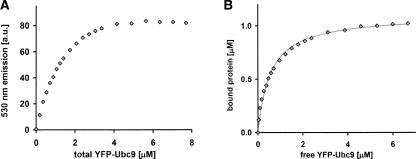
Figure 3.
Steady-state FRET binding assay: data analysis. (A) FRET data as a function of total YFP–Ubc9 concentration, following the subtraction of controls accounting for dilution (control 1) and direct excitation (control 2). (B) Bound protein determined from the FRET data as a function of free YFP–Ubc9 concentration, fitted by a hyperbola with B max = 1.1 μM and Kd = 0.59 ± 0.09 μM.

