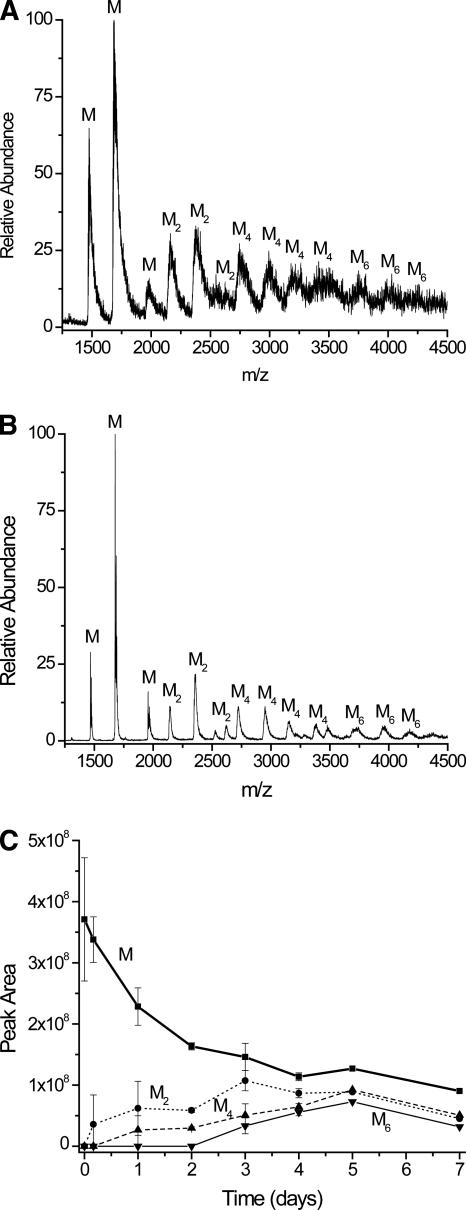
Figure 4.
Mass spectral data for β2m incubated with Cu(II) after desalting. (A) Mass spectrum obtained after a 5-d incubation, taken under low-energy ESI source conditions. (B) Mass spectrum obtained after a 5-d incubation, taken under high-energy ESI source conditions. (C) Ion abundances of β2m oligomers obtained over time. The ion abundance of each oligomer is the sum of the peak areas for each charge state of that oligomer. To account for day-to-day variability in the ion signal from the ESI source, the mass spectrum of a 5 μM solution of ubiquitin was analyzed immediately before the incubated sample. β2m oligomer ion abundances were then normalized to the ubiquitin ion signals each day so that the oligomer ion abundances could be compared from one day to the next.

