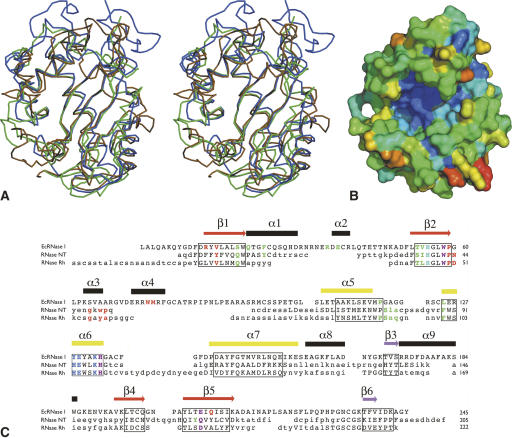
Figure 2.
Variability in the RNase T2 fold. (A) Superposition of the Cα-trace of EcRNase I (ochre) with those of RNase NT from N. Glutinosa as a plant representative (green) and RNase Rh from Rhizopus niveus as a fungal representative (blue). (B) Molecular surface showing residue conservation in bacterial T2-family RNases. The conservation score is color coded, going from dark blue (fully conserved) over light blue, green, yellow, and orange to red (most variable). The view of this surface is roughly identical to the one in Figure 1A. (C) Structure-based sequence alignment of EcRNase I, the plant RNase NT, and the fungal RNase Rh. Secondary structure elements of EcRNase I are indicated above the sequence and color-coded as in Figure 1. Residues that are structurally equivalent to those in EcRNase I are in uppercase. For the residues in lowercase, no structural equivalence is observed. The residues belonging to the structurally conserved core defined using all available RNase T2 coordinates are boxed. Functionally relevant residues are colored in the sequences: B1 site (red), catalytic site (blue), common to B1 site and catalytic site (purple), B2 site (green), common to B2 site and catalytic site (cyan).

