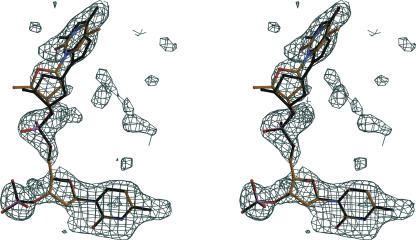
Figure 3.
Electron density for d(T/GpCp) bound in the active site of EcRNase I. Stereoview of the electron density (SA-OMIT map) calculated for the dinucleotide bound to the active site, which was interpreted as a mixture of d(TC) (colored) and d(GC) (black). The map is contoured at 2.2 σ. Although clearly present, the density for the oligonucleotide is weaker than that for the protein, and the total occupancy was estimated to be 0.7. d(TpCp) and d(GpCp) were both modeled with occupancies of 0.35.

