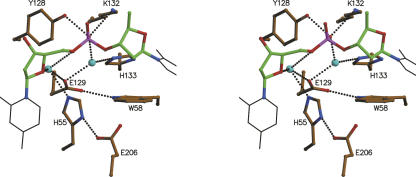
Figure 7.
Catalytic site of EcRNase I. Stereoview of the interactions in the catalytic or P1 site of EcRNase I. Shown are the relevant active site residues as well as the ribose-phosphate-ribose moiety in ball and stick and the cytosine and thymine bases as thin black lines. Other color-coding is as in Figure 4A. Relevant amino acids are labeled.

