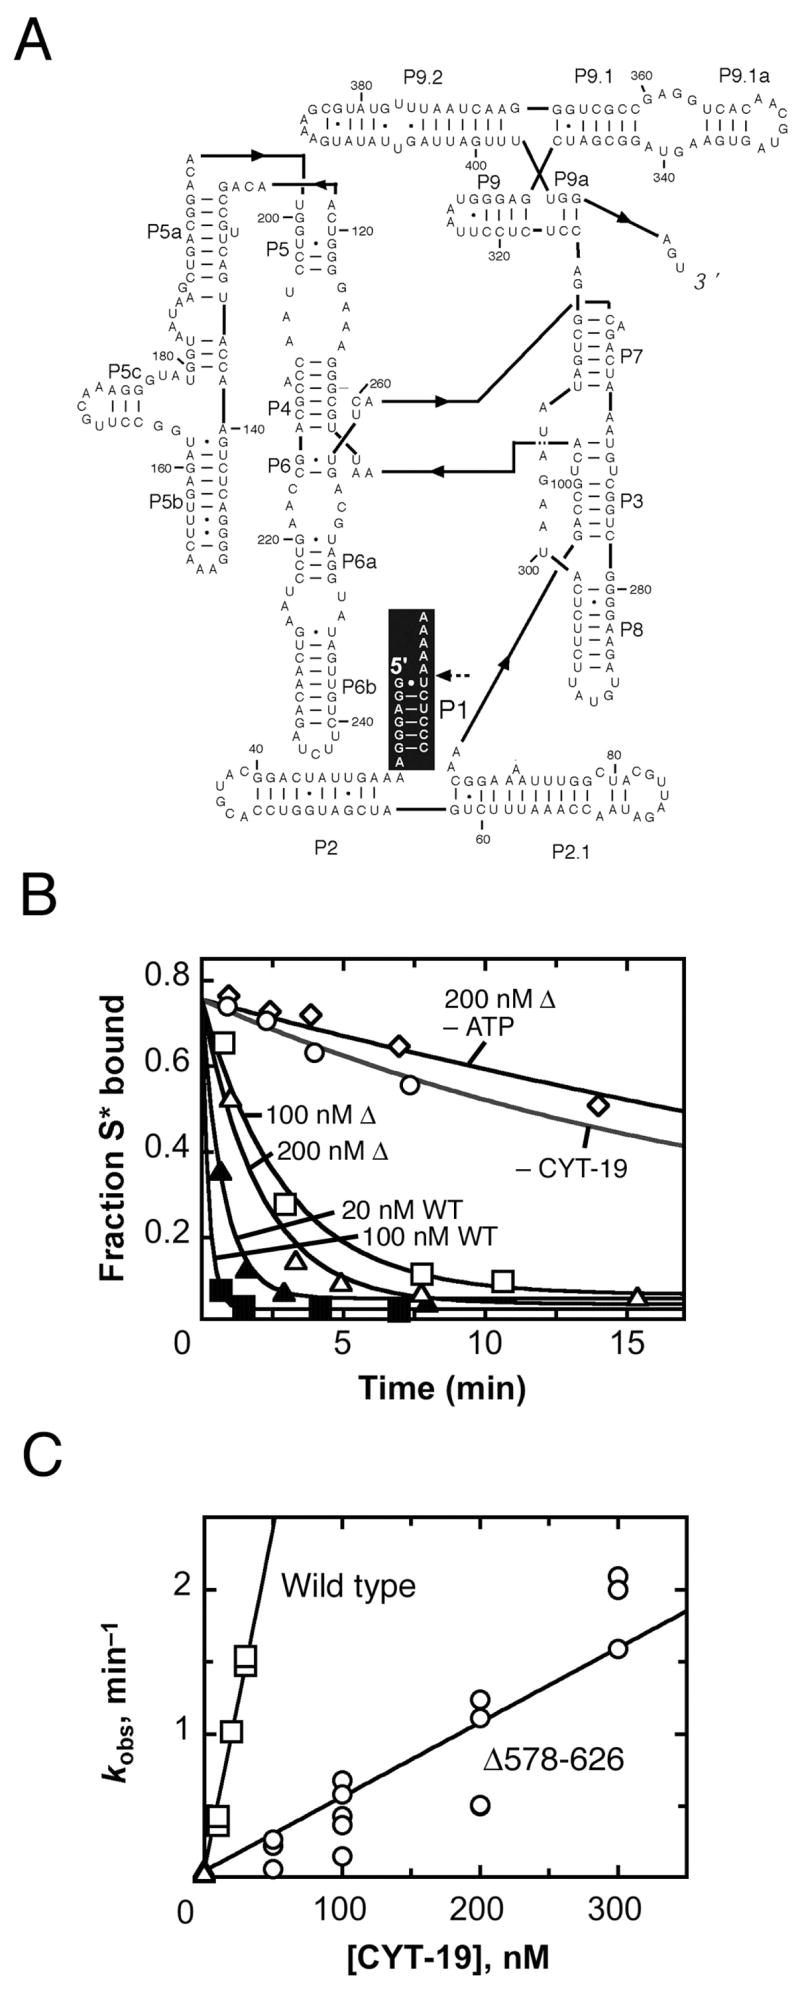
Fig. 2.

Acceleration of substrate dissociation from the Tetrahymena ribozyme. A, Secondary structure of the ribozyme. The P1 duplex, formed between the substrate and the ribozyme, is highlighted in black, with the substrate cleavage site indicated by a dashed arrow. B, Progress curves of substrate dissociation in the absence of CYT-19 (○, kobs = 0.033 min−1), in the presence of 100 nM (□, kobs = 0.32 min−1) or 200 nM (Δ, kobs = 0.49 min−1) Δ578–626 and 2 mM ATP-Mg2+, 200 nM Δ578–626 without ATP (◇, kobs = 0.028 min−1) or 20 nM (σ, kobs = 1.3 min−1) or 100 nM (ν, kobs = 4.7 min−1) wild-type CYT-19 and 2 mM ATP-Mg2+. C, Dependence of substrate dissociation rate on the concentration of Δ578–626 (○) and wild-type CYT-19 (□). Results from equivalent reactions without CYT-19 are also shown ( ). Four independent determinations gave a kcat/KM value of 3.6 (± 1.8) × 106 M−1 min−1 for the Δ578–626 protein, and three independent determinations gave a kcat/KM value of 4.1 (± 1.4) × 107 M−1 min−1 for the wild-type protein.
