Figure 2.
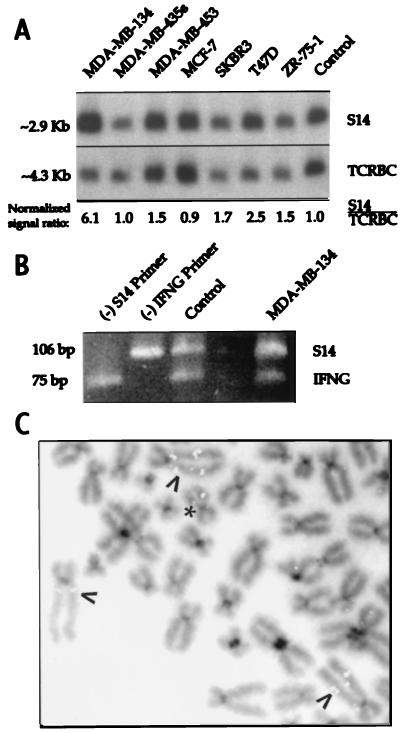
Amplification of the S14 gene in a subset of breast cancer cell lines. (A) Southern analysis of DNA from seven breast cancer cell lines. (B) Differential PCR analysis of MDA-MB-134 cell DNA. Genomic DNA from normal lymphocytes (control) or from MDA-MB-134 cells was used as template for a multiplex PCR, using two primers for the S14 gene (yielding a 106-bp product) and two for IFNG (75 bp). In the first two lanes, omitting primers for S14 or IFNG [indicated by (−)] resulted in the disappearance of the bands representing those genes. In the lane marked MDA-MB-134, the increased S14:IFNG signal ratio compared with the control lane reflects the presence of S14 gene amplification in those cells. (C) Fluorescence in situ hybridization analysis of MDA-MB-134 chromosomes by using a S14 probe. Arrows point to the HSR in the aberrant chromosome 11s, previously observed on cytogenetic analysis. Intense fluorescent signals representing the S14 gene colocalize with the HSR. ∗ denotes a normal chromosome 11.

