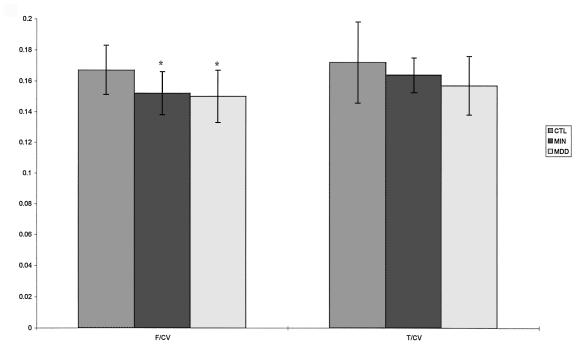
Figure 1.
A bar graph depicting normalized prefrontal and temporal lobe volumes in the three groups. CTL, controls; MIN, minor depression; MDD, major depression; F/CV, prefrontal volume/cranial volume; T/CV, temporal lobe volume/cranial volume. ∗, significantly different from controls, P < 0.05. SD bars are depicted in the figure.

