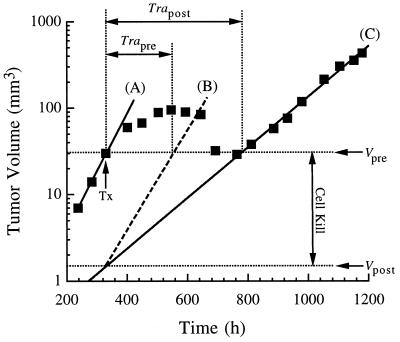
Figure 1.
Demonstration of the mathematical analysis of tumor growth and treatment. Data points are actual values obtained for a 9L tumor treated with a 2 × LD10 BCNU dose. The line marked A is the least-squares fit of the pretreatment growth points to Eq. 1. The line marked C is the fit of the posttreatment growth points. Line C is extrapolated back to the time of treatment to give Vpost. Log cell kill is the log of the ratio Vpre/Vpost (Eq. 2). The line marked B is the theoretical tumor regrowth curve assuming Tdpost = Tdpre. The relative contributions of cell kill and tumor growth rates are related to the calculated repopulation intervals, Trapre and Trapost, as described by Eqs. 3 and 4. Tx, point of BCNU administration; Trapre, repopulation interval given equivalent pretreatment and posttreatment growth rates; Trapost, repopulation interval given the fitted posttreatment growth rate; Vpre, tumor volume at Tx; Vpost, theoretical “viable” tumor volume immediately after treatment determined by extrapolation of C.

