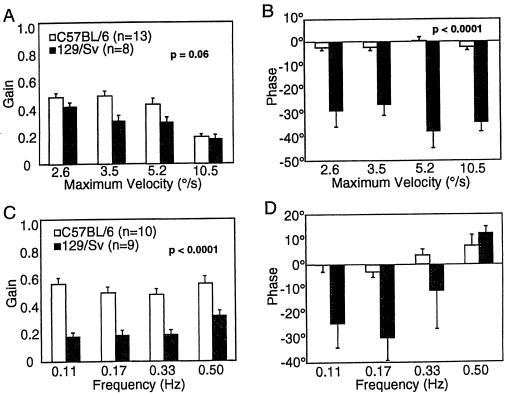
Figure 2.
Differences in dynamic characteristics of HVOR and HOKR between C57BL/6 and 129/Sv mice. (A) The gain of the HOKR and (B) the phase of the HOKR. The screen was sinusoidally oscillated by 5° peak to peak at 0.17 Hz (maximum velocity 2.6°/s), 10° at 0.11 Hz (3.5°/s), 10° at 0.17 Hz (5.2°/s), and 20° at 0.17 Hz (10.5°/s). (C) The gain and (D) the phase of the HVOR. The turntable was sinusoidally oscillated by 10° peak to peak at all frequencies. The P-values were obtained by the two-way ANOVA. The HVOR phases in 129/Sv mice at 0.11–0.33 Hz may include errors caused by too-low HVOR gains. Vertical bars indicate SE in all panels.

