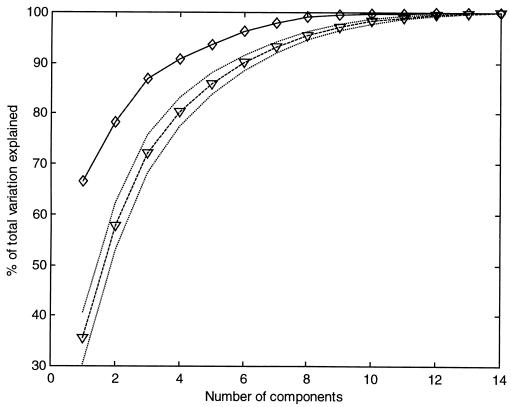
Figure 3.
Result of the principal component analysis and comparison with random fields. The solid line represents the fraction of the total variation explained by the first n principal components as a function of n computed for the vestibular data. The broken line represents the same quantity computed for an equal number of randomly generated fields with maximal dimensionality. The dotted lines are one SD above and below the mean.

