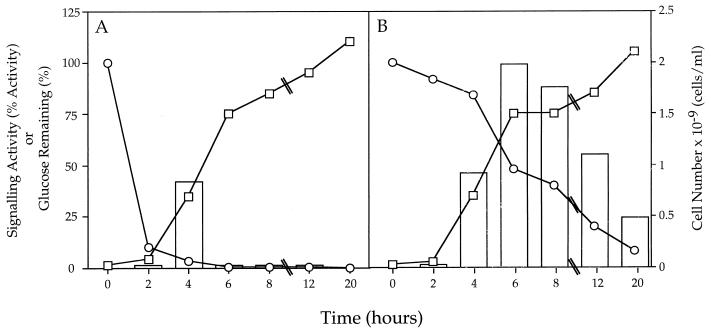
Figure 3.
Effect of glucose depletion on the production and degradation of the signaling activity by S. typhimurium LT2. S. typhimurium LT2 was grown in LB medium containing either 0.1% glucose (A) or 0.5% glucose (B). At the specified times cell-free culture fluids were prepared and assayed for signaling activity in the luminescence stimulation assay (bars), and the concentration of glucose remaining (○). The cell number was determined at each time by diluting and plating the S. typhimurium LT2 on LB medium and counting colonies the next day (□). The signaling activity is presented as the percent of the activity obtained when V. harveyi cell-free spent culture fluids are added. These data correspond to the 5-hr time point in the luminescence stimulation assay. The glucose concentration is shown as % glucose remaining. Cell number is cells/ml × 10−9. ⑊ indicates that the time axis is not drawn to scale after 8 hr. Replicate samples agreed within 10%.

