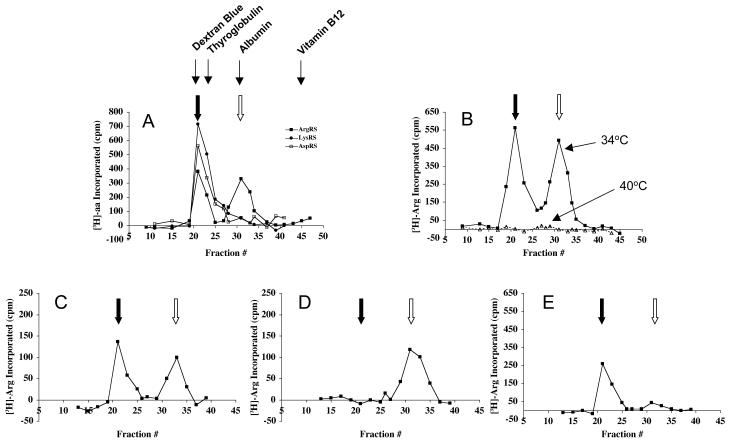
Figure 4. ArgRS activities determined by gel filtration.
Extracts from (A) CHO wt (1.0 mg total protein), (B) Arg-1 (1.2 mg), (C) WT (0.29 mg), (D) Mut1 (0.30 mg), and (E) Mut2 (0.50 mg) cells were applied to a column (0.7 × 50 cm) of Sephacryl S-300 equilibrated with 50 mM Tris-HCl, pH 7.5, 10% glycerol (v/v), 0.2 mM DTT, 0.2 mM EDTA, 100 mM NaCl. Fractions of 350 μl were collected. Portions of these fractions (60 μl) were assayed for 10 min at 34°C (A and B) or 40°C (B, C, D, and E). For part of B, C, D and E, fractions were preincubated at 40°C for 45 min prior to the aminoacylation assay. The filled arrow indicates the elution position of the high MW form of ArgRS present in the multisynthetase complex; the empty arrow indicates where free ArgRS is eluted. The elution positions of four protein size markers used to calibrate the column are shown. These are Dextran Blue 2000 (MW 2000 kDa), thyroglobulin (MW 650 kDa), serum albumin (MW 67 kDa), and vitamin B12 (MW 1.3 kDa). Note the different scales for ArgRS activity due to different amounts of extract loaded in the various experiments. Panel A also shows the elution profiles of LysRS and AspRS.

