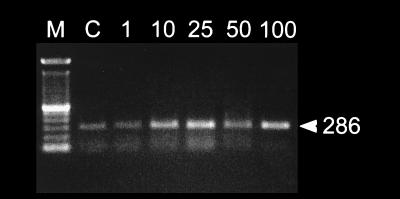
Figure 3.
RT-PCR analysis of flk-1 mRNA expression in E18 cortical explant cultures incubated with VEGF doses for 3 days. Each lane was loaded with 10 μl of PCR product. M, marker (100-bp DNA ladder, Life Technologies); C, control explant, which received no VEGF. Size of expected flk-1 fragment, in bp, is at right.

