
Figure 3A–B.
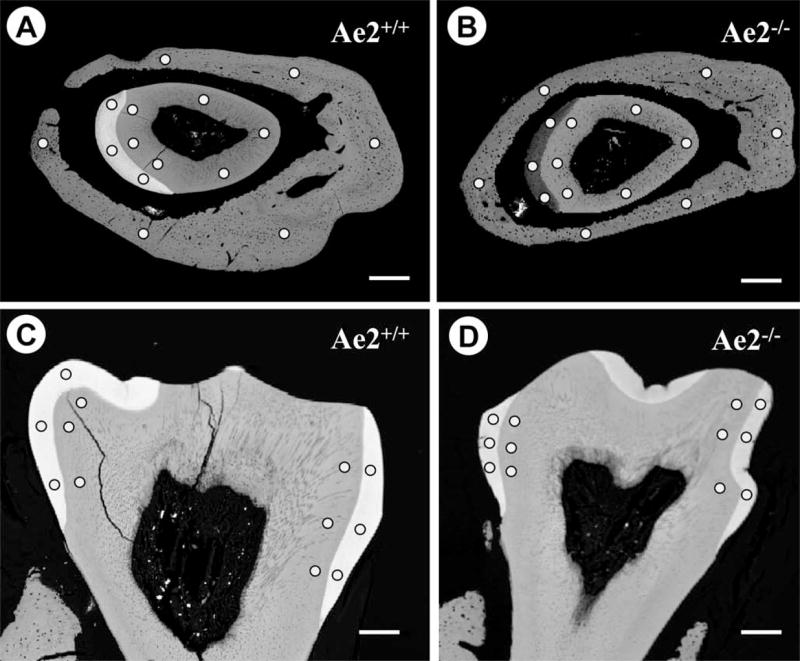
Low power back-scattered detector (BSD) micrographs and electron microprobe analysis areas: Fig. 3A is a BSD image of an Ae2a,b+/+ specimen cut through the maturation stage incisor enamel and that from the Ae2a,b−/− specimen is shown in Fig. 3B. The low contrast in the Ae2a,b−/− enamel compared to the Ae2a,b+/+ specimen indicates low level of mineralisation. Fig. 3C is of an Ae2a,b+/+ first molar and Fig. 3D of an Ae2a,b−/− specimen. Note that the difference in electron density between the Ae2a,b+/+ (Fig. 3C) and Ae2a,b−/− molar enamel (Fig. 3D) is less pronounced than that seen in the incisors (cf. Fig. 3A & B above). All the images were acquired under identical microscope parameters. The areas analysed for mineral content in enamel, dentine and bone are shown by dots. (Bars=300μm).