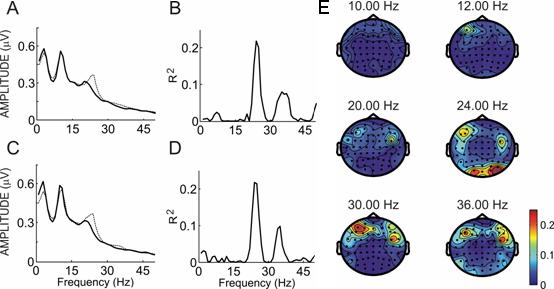
Figure 5.

Spectral power and R2 values for subject K. Panels A and C show the power spectra over sites O1 and O2 from 0−65 Hz when the subject focused on the colored 10 Hz linebox (solid line) or the 12 Hz linebox (dotted line). Panels B and D show the R2 between the two lines in panels A and C. Panel E shows a topographic map of R2 differences at all sites for that subject over six frequencies: the two stimulation frequencies (10 and 12 Hz) and the second and third harmonics of each.
