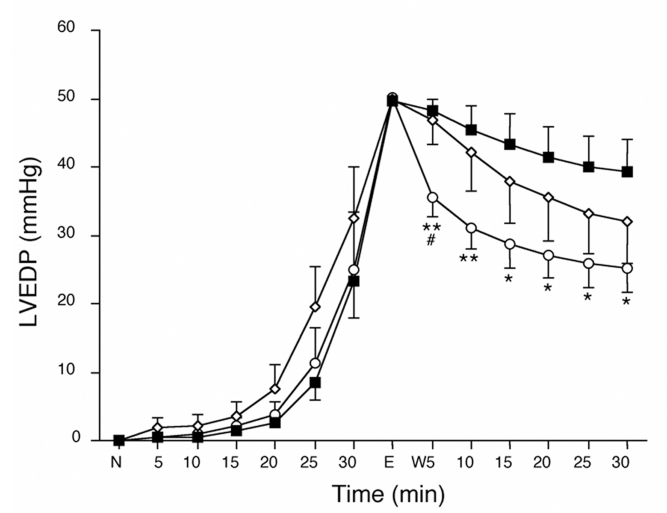
Figure 5.
Time courses of left ventricular end-diastolic pressure (LVEDP) during H2O2 washout perfusion (W). The LVEDP was normalized at the ‘normal point’ (N) and then evaluated at various times. The decrease in LVEDP in hearts of the ischemic postconditioning group (open circles) was lowest among the groups after 5 min, and was still lower than in the hearts of the control (CT) group (closed squares) during washout. The decrease in LVEDP in the hearts of the ischemic preconditioning group (open diamonds) was not statistically different than that in the hearts of the CT group at the end of washout. *P<0.05 and **P<0.01 versus the CT group; #P<0.05 versus the ischemic preconditioning group. E End time of perfusion with H2O2

